
From the original GUI I know that the RF power sensor requires to input the measurement frequency with a resolution of 1 MHz. This is the reason why I decided to scan my SMY02 from 1 MHz up to its highest output frequency of 2080 MHz in steps of 1 MHz.
For the levels, I chose a step size of 5 dB beginning at -60 dBm and ending at +15 dBm. For levels above +13 dBm an error LED lights up on the SMY02, showing that these levels are potentially inaccurate.
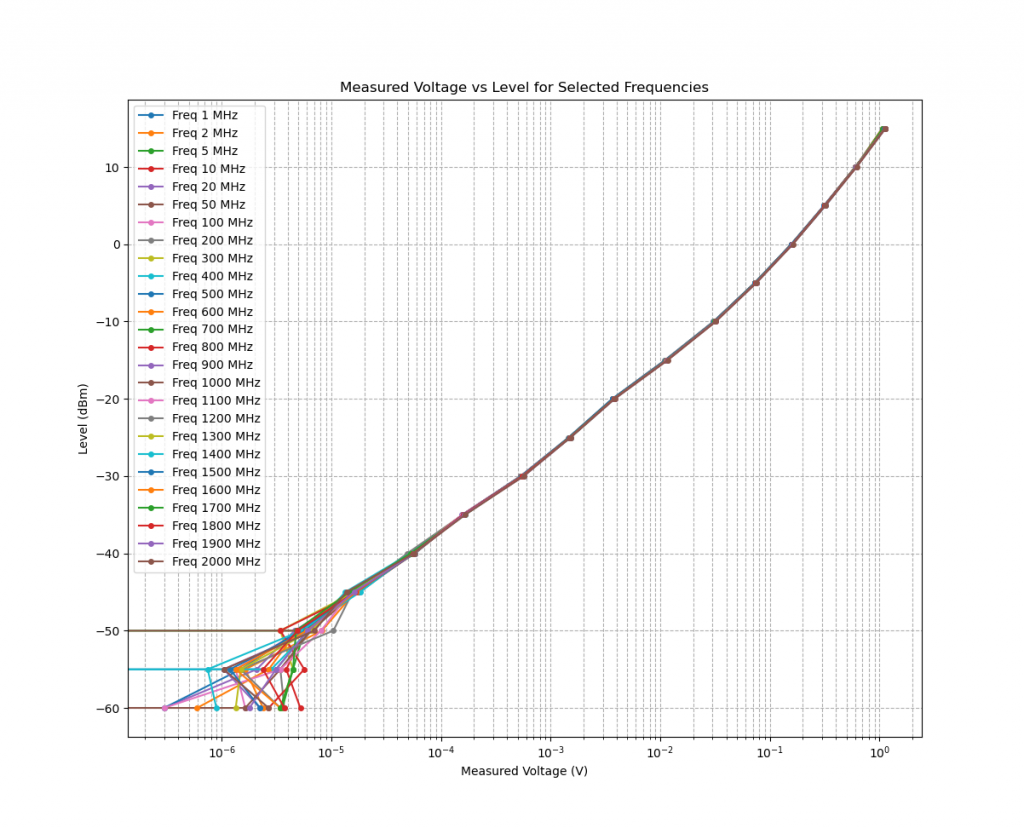
The measurements were taken at an average temperature of 26.237 °C. Below -40 dBm, the measurements become increasingly noisy, as can be seen in the diagram above.
If you look closely, you’ll see that the measurement curve isn’t entirely smooth around -20 dBm. I suspect this is due to the less-than-perfect calibration of my SMY02. Such a dip in the transfer function doesn’t fit the physics of a diode.
The next diagram shows the frequency dependency of the RF detector voltage at selected power levels:
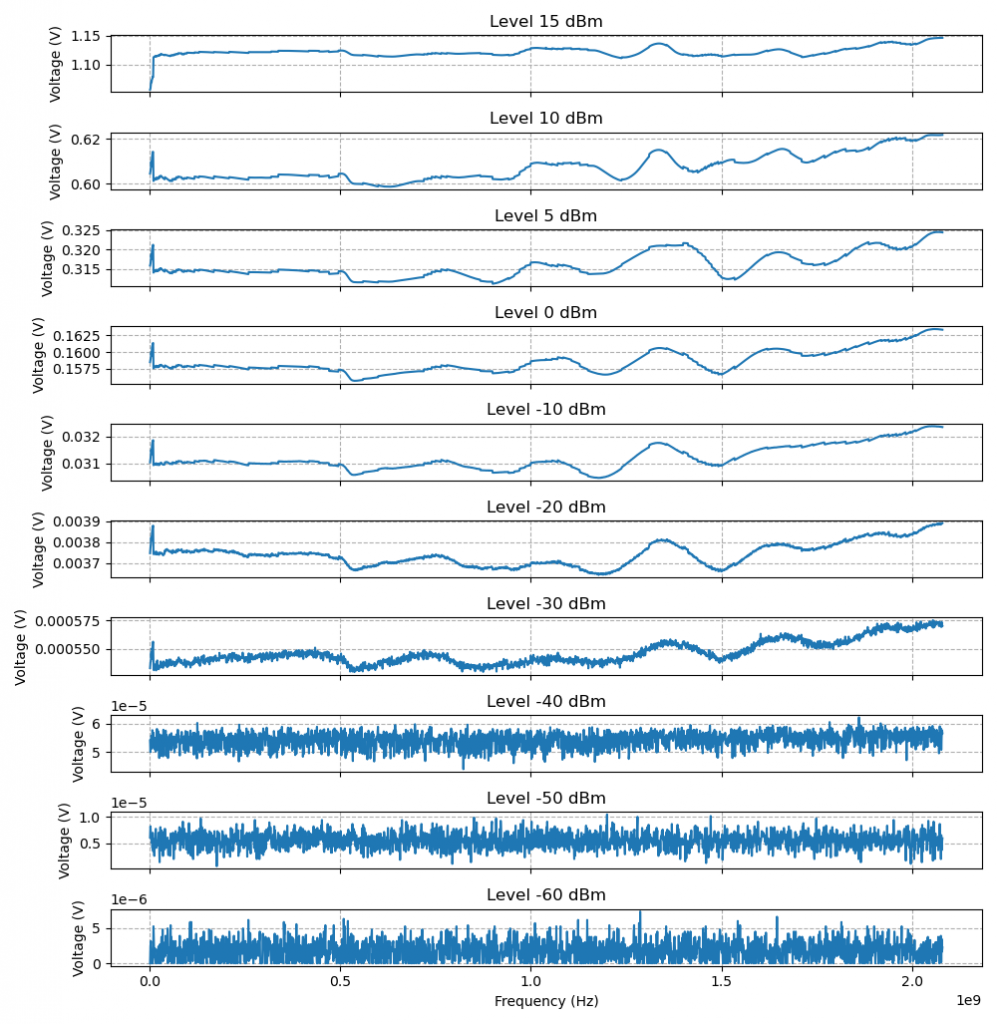
With such precise measurements, I can’t tell whether this graph actually shows the frequency response of the diode detector or rather the frequency dependence of the output level of my SMY02.
Perhaps I can repeat this measurement later with a different signal generator?
Hello
Deeply impressed by your blog content which means a lot to electronic enthusiasts.
I’d like to sponsor your project by providing free PCB prototyping,
only hoping for a slight promotion or a review about quality or service in return.
Would you be interested in partnering up?
Thank you! Yes please contact me.