
The STM32H7-application sends ADC data to the PC via USART3. Rx and Tx of USART3 are connected to the ST-Link debugger on board of the NUCLEO-STM32H743ZI. The ST-Link driver that gets installed when you install the STM32CubeIDE supplies also a virtual COM port that can be used for communication with the NUCLEO board.
After starting the firmware on the H7, I also started the supplied Python skript DISPADCFFT.py.
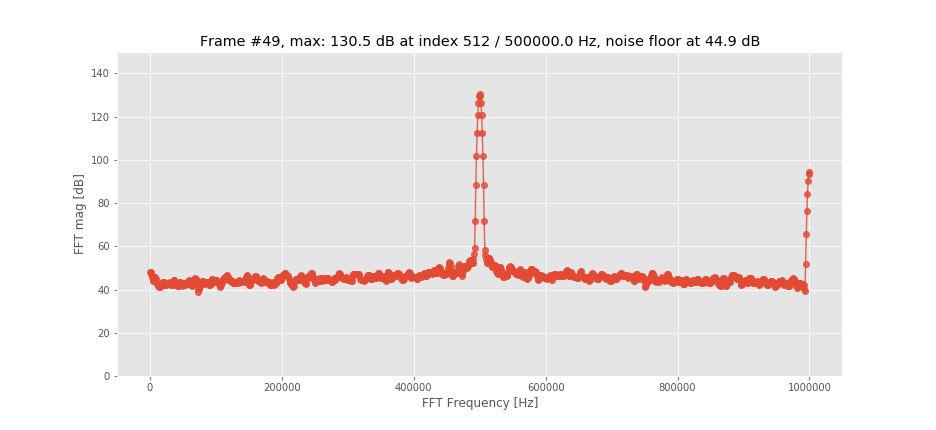
As was explained in Part I, the Python script reads a block of data from the serial port, performs a FFT transformation and displays the FFT magnitude spectrum on a dB scale.
In the title of the display, the location and the dB amplitude of the highest peak are displayed, together with the dB value of the noise floor.
I cranked up my RF generator to an output level of 13 dBm, which gives ADC readings in a range of about 17000 up to 49000, which is about 50% of full-scale. My RF generator could go higher, but these higher levels are not calibrated, so I decided to stay at 13 dBm.
Differential Input
I began with the differential version. The ADC sampling rate was always 2 Msps.
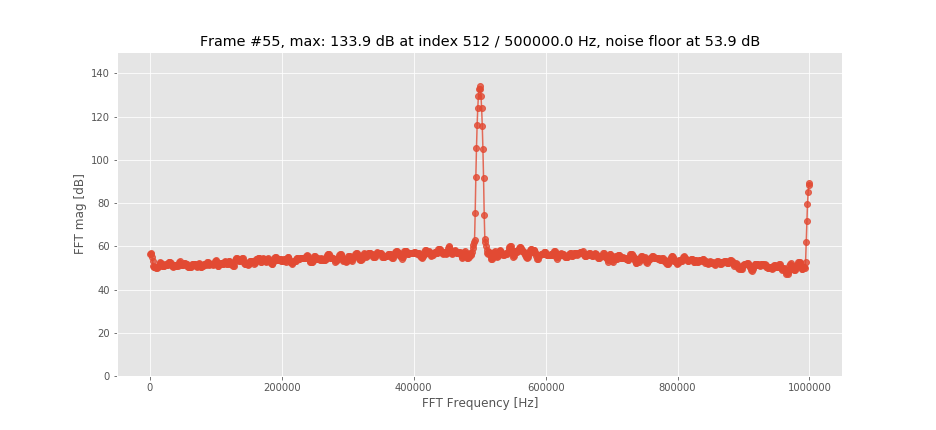
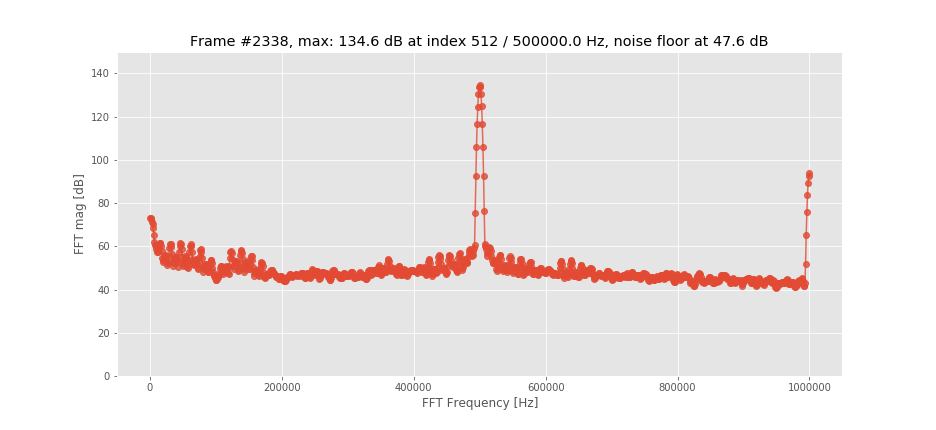
At an input frequency of 0.5 MHz the display looks as this:
Undersampling begins with the next frequency, 1.5 MHz:
The peak at 1.5 MHz is a little higher than the peak at 0.5 MHz, because the transformer is actually made for the MHz-range and not for 0.5 MHz.
I stepped up the frequency another MHz and another MHz, until I reached 20.5 MHz. Now I increased the step size to 10 MHz until I reached 100.5 MHz. I increased the step size again, now to 100 MHz, until I reached 1300.5 MHz.
It was only at this high frequency that the spectral line could no longer be clearly distinguished from the background.
This is the spectrum at 1200.5 MHz:
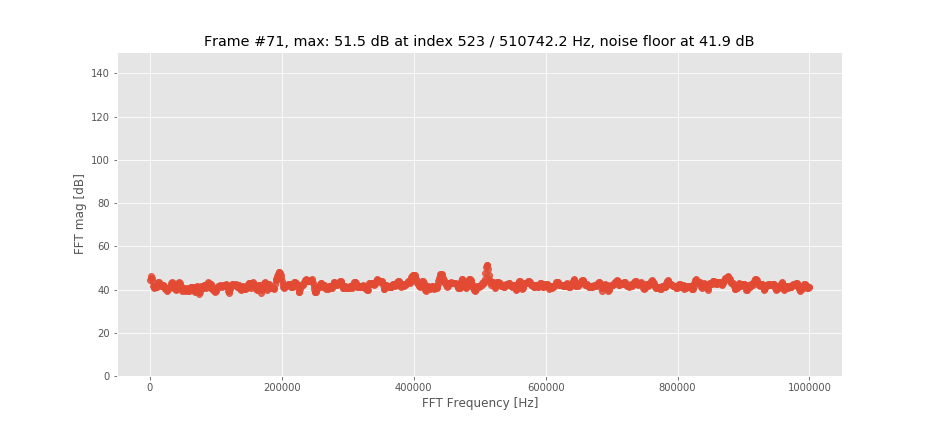
And this is the spectrum at 1300.5 MHz:
Then I changed to the single-ended version and did the same measurements.
Single-Ended Input
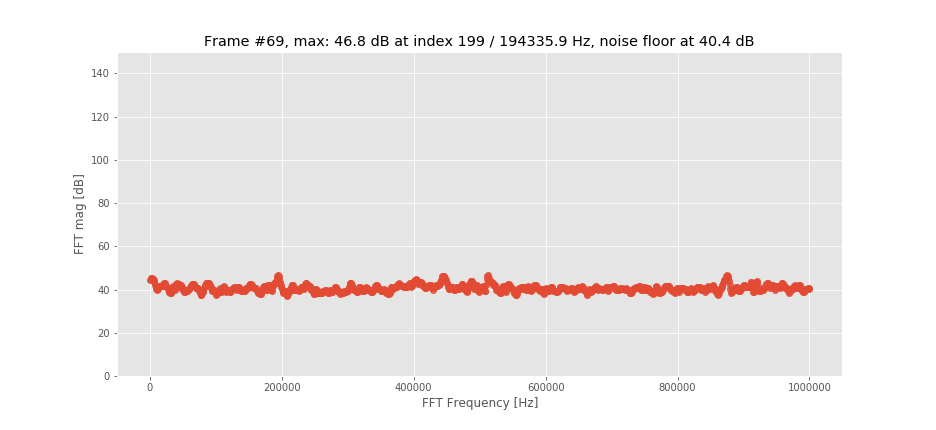
With low input signals or without a connected cable, the single ended spectrum showed disturbances at low frequencies that could not be observed on the differential version: 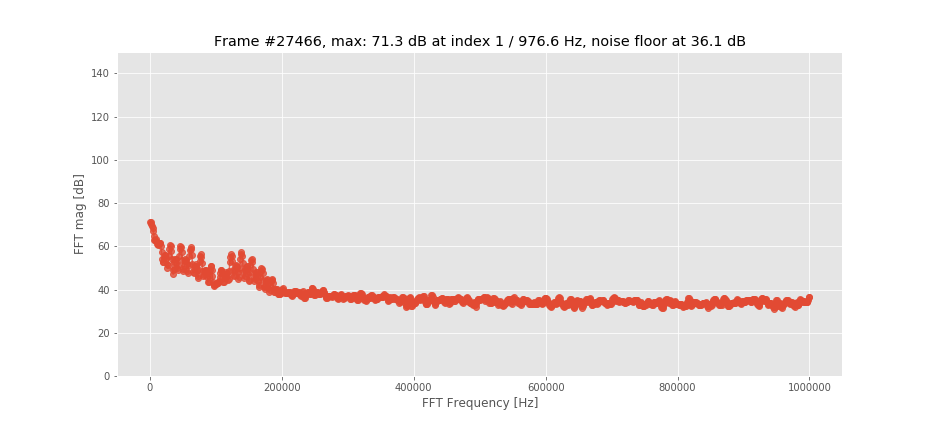
Other than that, the single-ended spectra look the same. This is the single-ended spectrum at 0.5 MHz:
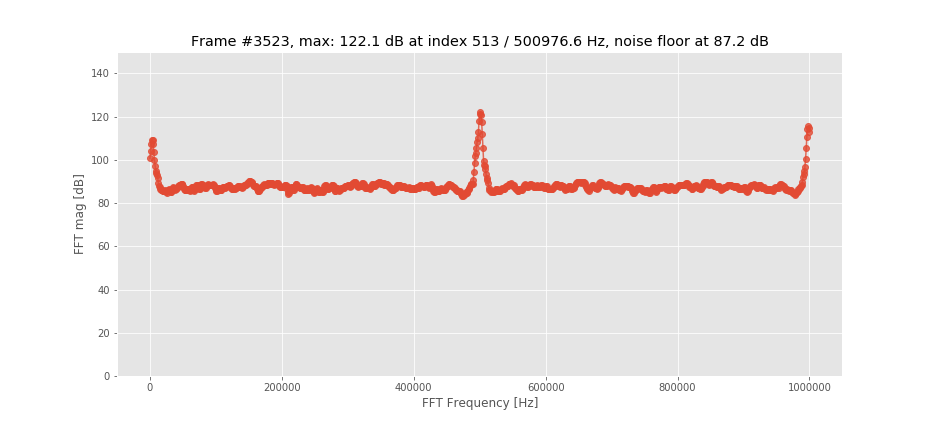
And this is the single-ended spectrum at 100.5 MHz:
Summary:
The following diagram shows the condensed results of all measurements:
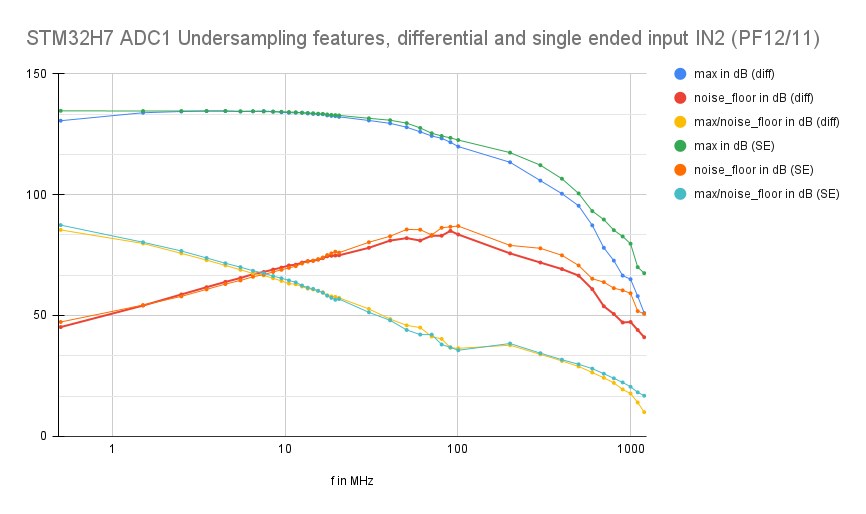
The horizontal axis goes from 0.5 MHz, which was the lowest frequency that I applied to the ADC input, up to 1300.5 MHz, which was the highest frequency.
The vertical axis is a dB axis. Around 134.6 dB is equivalent to 0.5 x full scale of the ADC.
The upper two curves in blue and green show the amplitudes of the peaks in the spectra, and the green and yellow curves show the background noise amplitudes.
(diff) means „differential input“, i.e. measured using the transformer circuit shown in part I of this blog.
(SE) means „single ended“, that means measured using the circuit for single-ended measurements shown in part I of this blog.
The orange and red lines show the ratio of the peak values to the noise or the „signal-to-noise ratio“.
Discussion of the results:
The first feature that struck me was the strong response of the ADC even to very high frequencies. I did not expect to see significant amplitudes of spectral lines above some ten MHz!
… to be continued
Hallo DM1CR,
interessante Ergebnisse für dieses Board.
Ich arbeite mit einer anderen Zielsetzung mit dem Board Nucleo-H743ZI:
Zur Analyse der Sinus-Cosinus-Signale eines Drehgebers taste ich die Signal bei konstanter Drehzahl ab. Hierbei ist die Signalperiode möglichst ein ganzahliges Vielfaches der Abtastfrequenz.
Meine Ergebnisse zeigen eine effektive Anzahl von 9 Bits (ENOB). Ich habe dabei die ADUs auf 14 Bit eingestellt.
16 Bit ist dabei recht sinnlos. Die Signal sind „single ended“. Ihre Ergebnisse zeigen auch aufgrund des SNR eine ENOB von 9. Jetzt habe ich mir durch eine differentielle Ankopplung evtl. ein Gewinn von 1 Bit versprochen. Ihre Ergebnisse zeigen dabei aber keine deutliche Verbesserung.
Recht gut hat die Überabtastung funktioniert. Bei einer Überabtastung von 32 liegt ENO bei 12 Bit. Dies ist für eine Bandpassabtastung natürlich nicht zu gebrauchen.
Haben Sie noch Ideen warum die Ergebnisse mit dem Nucleo Board so schlecht sind? ST verspricht ein ENOB von mindestens 13 Bit ohne Überabtastung.
Ein Grund könnte die Verwendung der Betriebsspannung (3,3V) als ADU Referenzspannung sein…
Viele Grüße
Stefan Cramer
Hallo Stefan Cramer,
ja, die Referenzspannung ist definitiv verbesserungswürdig.
Ich habe leider keine quantitativen Messergebnisse vorliegen, aber ich kenne jemand, der auf dem NUCLEO-Board die Referenzspannung des ADCs abgetrennt hat (R37 ausgelötet) und die 3.3V von einem HP6114a (=rauscharme Laborspannungsquelle) hat liefern lassen. Die Ergebnisse waren signifikant besser.
Auch vom Gehäuse der MCU und von der Wahl des ADC-Eingangstyps (direct, fast oder slow) hängen die erreichbaren ENOB ab. Beim NUCLEO-Board hat man bzgl. MCU-Gehäuse natürlich keine Wahl, aber möglicherweise sind PC2/PC3 differentiell benutzt noch die beste Wahl bei diesem Board?
In dieser AppNote steht einiges zu diesem Thema:
https://www.st.com/resource/en/application_note/dm00628458-getting-started-with-the-stm32h7-series-mcu-16bit-adc-stmicroelectronics.pdf
Viele Grüße
DM1CR